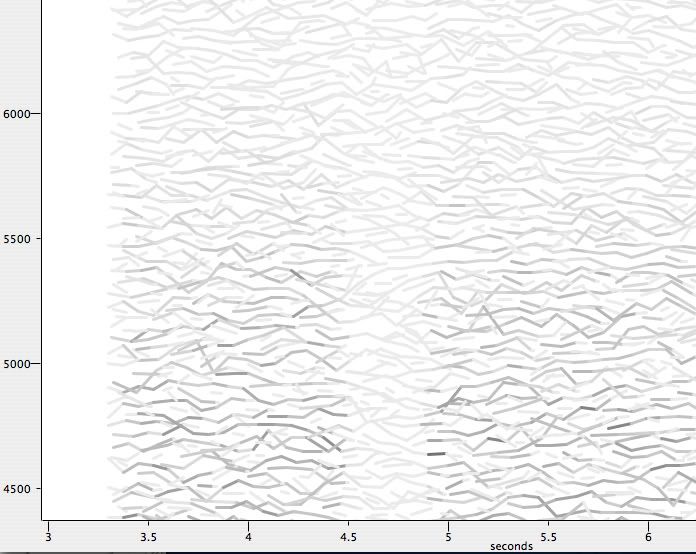
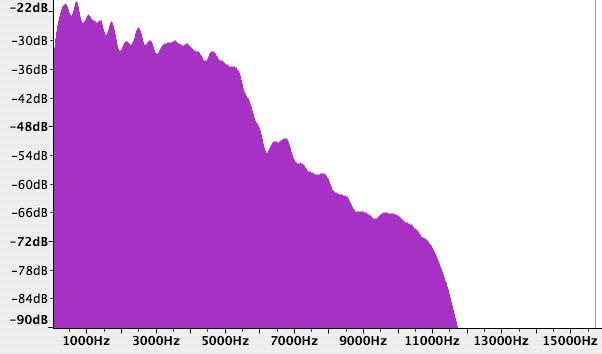
For the Frequency Spectrum graphs to mean anything, the players have to have exactly the same note compared with no background instruments or whatever and the exact same part of the note compared.
The beginning attack of a note is very different to the note a few milliseconds after when the attack is decaying, and the frequencies in a Frequency Spectrum graph will vary accordingly with the attack and decay parts of a note.
That's why the hardest part about Frequency Spectrum comparison graphs is setting up the initial test conditions so they are the same for all participants as much as possible and even then there will be variations that have to be allowed for.
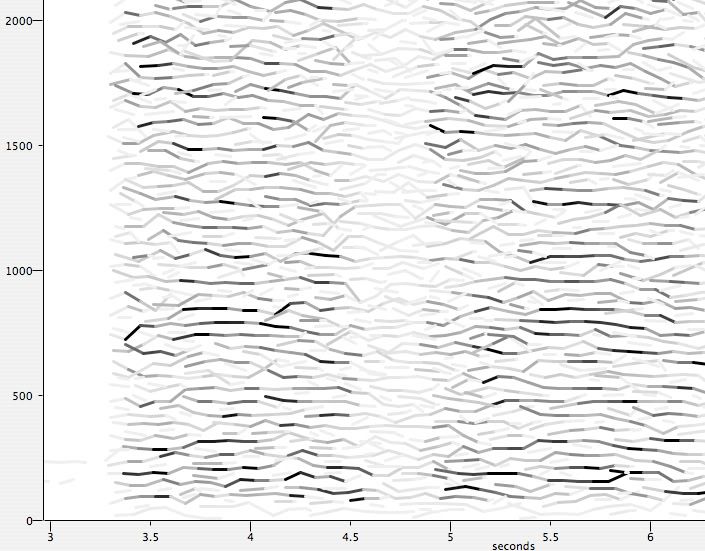
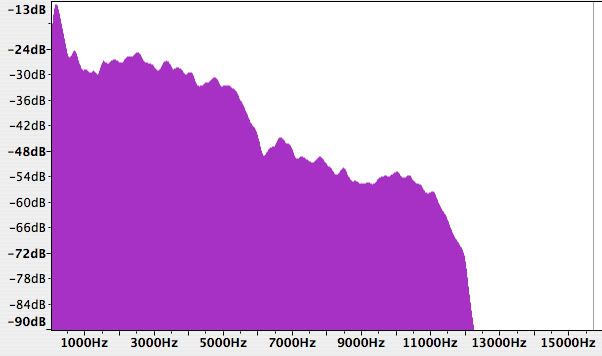
Even after all that, every player has their own attack when playing the same note so the Frequency Spectrum frequency graphs will vary according to each players initial attack of the note and it's not the same for different players.
A Robot device with computer precision attack would be needed to set the note in motion in the first place, in all of the comparisons so that the initial attack was consistent for all comparisons as much as possible.
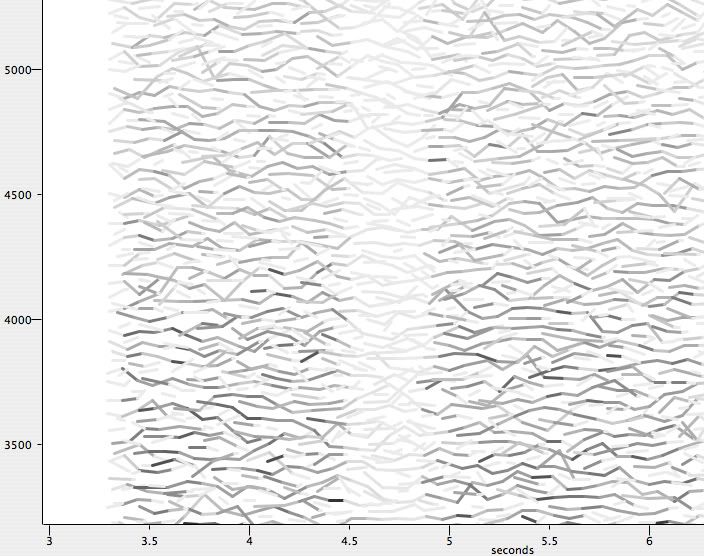
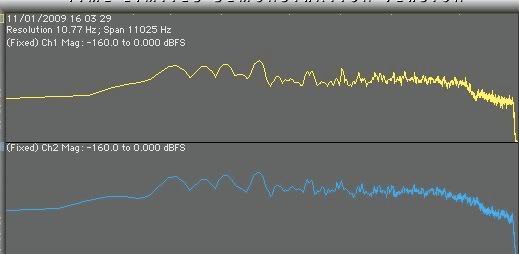
When I was doing the Sinasl1 ATBL Frequency Spectrum comparison with Ed
http://forum.metroamp.com/viewtopic.php ... 3&start=75" onclick="window.open(this.href);return false; it wasn't that bad because Sinasl1 was in sync with Ed, there was Sinasl1 in one channel and Ed in the other channel and the part of the particular ATBL note being compared was pretty similar in terms of attack and decay and pitch because Sinasl1 had played and put his track in sync with Ed's.
Sinasl1 still had a different note attack than Ed though and that's one of the reasons why Sinasl1 doesn't sound exactly like Ed in the first place.
btw I can't imagine Ed using a EQ on ATBL, mainly because Ed has 2 Echoplexes on it with 2 different delays (around 150ms and 300ms or something like that) that creates that distinctive opening riff timing. A EQ would just be in the way of the 2 Echoplexes IMO.
Usually Ed just uses 1 Echoplex but Ed has 2 Echoplexes on ATBL that enhance the opening riff.
Ed is yellow or channel 1 or the top graph and Sinasl1 is blue or channel 2 or the bottom graph.
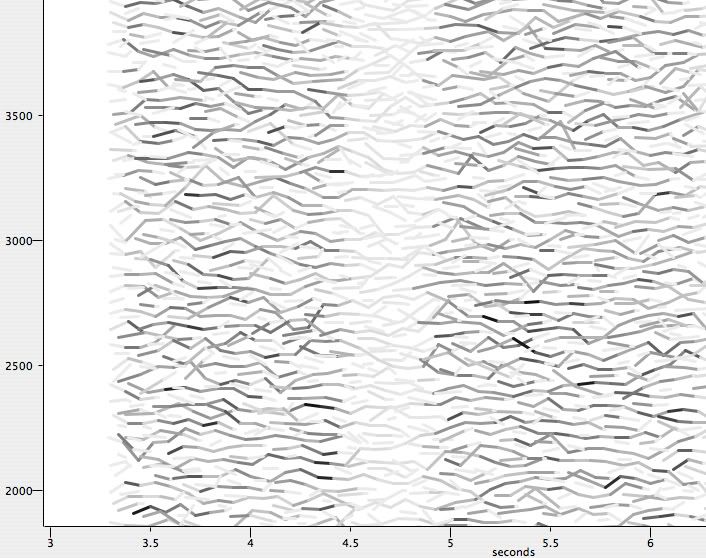
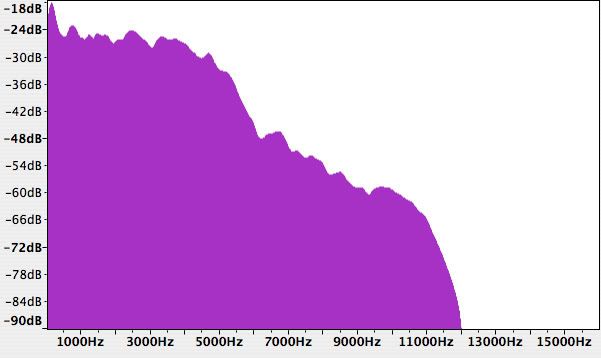
In other words, there will always be a part of how the harmonic frequencies will display themselves in a Frequency Spectrum graph, that is due to the player and their own note attack.
Tone in the hands.
The initial attack of the note is one of the initial causes of why players can sound different playing the same gear.
Get a Saxophone or a Violin and just for the same one note, hand it to a beginner and then hand it to a professional and it will not sound the same even though it's the same Saxophone or Violin being played by both the beginner and professional and the difference is mostly in the initial attack of the note by the beginner or professional and id a Frequency Spectrum comparison was done on the beginner and professional players same instrument, same note and same part of the note, then the differences would show up in the Frequency spectrum graph and these differences would be due mostly to the differences of the initial attack of the note.


Just as I suspect forumite guitarists showing signs of hearing loss in the lower frequencies..from too much feedback exposure..